Reduce MySQL CPU Usage Through Dynamic Binary Optimization
Dynimize, a dynamic binary optimizer, has been shown to improve MySQL performance in CPU intensive workloads. This post explores how Dynimize can be used to instantly reduce MySQL CPU usage without altering a single line of your application code or my.cnf.
You notice that the Linux top command shows that mysqld is consuming a lot of CPU resources, and you're worried that you're not leaving this server with enough breathing room. You've tried every piece of advice out there and nothing seems to make much of a difference to help reduce CPU usage. Or maybe it did help, but you'd still like to reduce CPU usage even further.
Sometimes high MySQL CPU usage isn't the sign of a poorly written query or incorrectly configured database. Sometimes it's simply caused by having a high traffic workload. When we have a large volume of well indexed queries hitting the buffer pool in memory, the performance bottleneck can get pushed to the CPU. In light of that, this post is not about "fixing" high MySQL CPU usage as if it were some sort of bug or "mistake" you've made in your configuration, tables or queries. It's about enhancing the CPU performance and CPU efficiency of MySQL and MariaDB beyond what is possible by application or configuration changes alone. Let's explore further.
Enter Dynimize
Dynimize is a dynamic binary optimizer by functioning as a machine code JIT compiler. You may have heard of JIT compilers for Java, which take in Java bytecode and live profiling information and combine the two to generate optimized machine code on the fly. Dynimize works on the same principles, except instead of taking in bytecode plus live profiling data, it takes in the in-memory x86-64 machine code of regular Linux processes plus live profiling data, and combines that to generate machine code that is optimized based on the current workload.
Below is a diagram of how it works:
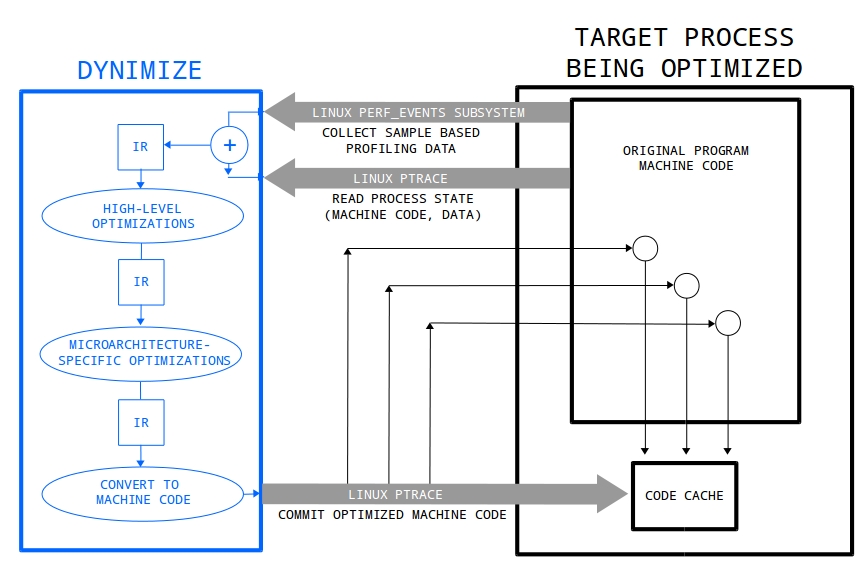
Stop and think about this for a second. Dynimize takes in-memory machine code and live profiling info of other processes as inputs and then produces more optimal machine code for those processes. You are probably thinking that the applications are vast. Indeed they are, however here we are only applying this to MySQL and MariaDB.
Dynimize performs this in a transparent manner, meaning that you don't need to modify your application, migrate servers, or even restart MySQL to apply Dynimize. This results in far less technical risk than what is usually undertaken when optimizing a database workload (outside of tuning a few my.cnf values). This also means that you can get immediate results with only a few simple commands, without any real effort or expert knowledge.
Using Dynimize
To install Dynimize, run the following commands in a Linux terminal.
wget https://dynimizecloud.com/install.sha256 -O install.sha256
sha256sum -c install.sha256; if [ $? -eq 0 ]; then sudo bash ./install; fi
Use your access token to start a subscription license for your host.
To optimize any CPU intensive process who's exe is listed in the [exeList] section of /etc/dyni.conf, run:
The command dyni -status will show target processes progressing from the "profiling", to "dynimizing", and then "dynimized" states. A process has been fully optimized once in the "dynimized" state:
mysqld, pid: 8375, dynimizing
mysqld, pid: 8375, dynimized
Follow this tutorial for help measuring the performance impact.
Reducing MySQL CPU Usage
For the remainder of this post we will explore different scenarios where Dynimize reduces CPU usage for both MySQL and MariaDB on DigitalOcean, AWS EC2, and Packet using both virtual and bare metal servers. All scripts used to run these test, the my.cnf and the output of these runs can be found in this GitHub repository. The exact instance type and software stack used is listed below, and when combined with this repository one can easily run these experiments in the exact same manner. Note that in every case we performed a short warm-up run before taking measurements, to allow mysqld to become dynimized beforehand on the runs where Dynimize was in use.
It should be noted that these tests were done using fixed rate workloads. By using a fixed rate workload, improvements in CPU performance result in a reduction in CPU usage, since mysqld will not need to consume as many CPU time slices to accomplish the same amount of work. This is also more realistic than simply running at full capacity and watching throughput increase once optimized, since most online MySQL workloads are a function of traffic volume, which is not in your control and unfortunately will not magically increase by simply improving the performance of your server!
Point Select
Point selects are the bread and butter of many MySQL workloads. If your high traffic workload is performing many select queries that are properly indexed, you have a sufficiently sized buffer pool, and you've done everything to optimize the my.cnf, what else can you really do other than change your application or architecture to start caching results, or migrate to a more expensive machine? If modifying the application is even feasible, that could be a very labour intensive, high risk endeavour that could take time to implement. We'd also like something that involves as few changes as possible to minimize technical risk. Something as trivial as tweaking a setting in your my.cnf. So let's try Dynimize using Sysbench running well indexed point selects with a fixed transaction rate.
In this test we ran the Sysbench OLTP point select benchmark using 10 tables of 30 million rows each, for a total of 61 GB, with a buffer pool size of 24 GB, and a Pareto distribution with h = 1.0. By using a database that can't fit into memory, and a Pareto distribution that results in most transactions hitting the buffer pool, we create a somewhat realistic scenario that resembles a well tuned database. This was run on an 8 core DigitalOcean droplet using mysql 8.0.18 on Ubuntu 18.04 LTS. A fixed rate of 25000 queries per second was used, and binary logging was enabled.
Hardware
| Instance Type | DigitalOcean droplet |
|---|---|
| Cores | 8 virtual |
| CPU Model | Xeon E5-2650L v3 / 1.80GHz |
| RAM | 32 GB |
| Storage | 640 GB SSD |
Software
| MySQL | 8.0.18 |
|---|---|
| Distro | Ubuntu 18.04.3 LTS |
| Kernel | 4.15.0-66-generic x86_64 |
| DB Size | 61 GB |
| Buffer Pool Size | 25 GB |
| Workload | Sysbench 1.0.19 OLTP Point Select |
Sysbench command:
sysbench \
 /usr/share/sysbench/oltp_point_select.lua \
 --table-size=30000000 \
 --tables=10 \
 --mysql-db=sbTest \
 --mysql-user=root \
 --mysql-password= \
 --time=1830 \
 --threads=16 \
 --rand-type=pareto \
 --rand-pareto-h=1 \
 --db-driver=mysql \
 --rate=25000 \
 --report-interval=1 \
 --max-requests=0 run
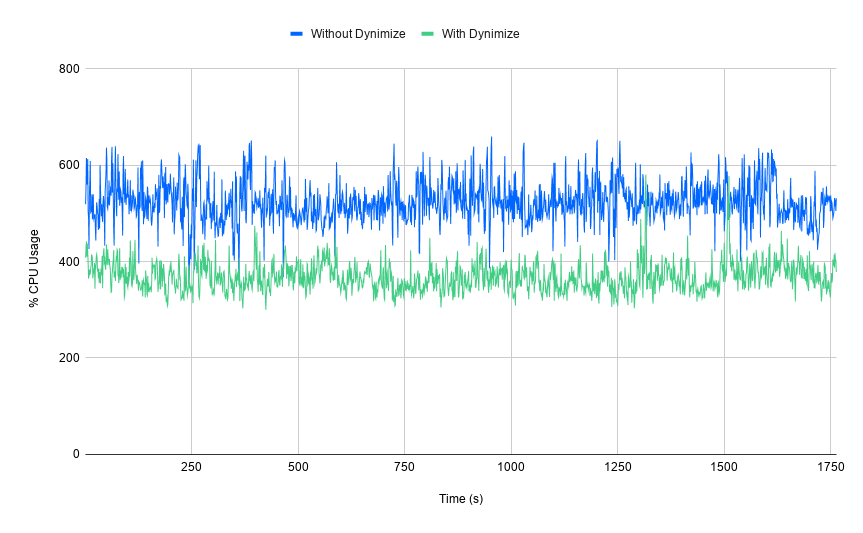
Here we ended up with an overall average improvement factor of 1.44 (total CPU usage before / total CPU usage after), with total CPU usage reduced by 31%. We track this type of improvement factor going forward, since it allows us to easily relate this to performance. For example, a 2X improvement in performance will result in a CPU usage reduction of 50%.
TPC-C
Next lets try this on something more complex like the TPC-C benchmark, an OLTP workload which is relatively heavy on writes. We'll use sysbench-tpcc to run these transactions at a fixed rate of 7500 TPS, with binary logging enabled. Note that this benchmark is not certified by the TPC council and its results cannot be considered official TPC-C results, however it does provide us with an interesting test regardless:
In this instance we're using MariaDB 10.4 on a dedicated 4 core server. The Sysbench Pareto distribution didn't seem to work for tpcc so we left it out.
sysbench-tpcc command:
./tpcc.lua \
--mysql-user=root \
--mysql-db=tpcc \
--time=180 \
--rate=7500 \
--threads=56 \
--report-interval=10 \
--tables=10 \
--scale=100 \
--db-driver=mysql run
Hardware
| Instance Type | Packet m2.xlarge.x86 |
|---|---|
| Cores | 28 physical / 56 threads |
| CPU Model | Xeon Gold 5120 CPU / 2.20GHz |
| RAM | 382 GB |
| Storage | 2.9 TB Micron 8200 NVME |
Software
| MariaDB | 10.4.10 |
|---|---|
| Distro | Ubuntu 18.04.2 LTS |
| Kernel | 4.15.0-50-generic x86_64 |
| DB Size | 100 GB |
| Buffer Pool Size | 128 GB |
| Workload | sysbench-tpcc |
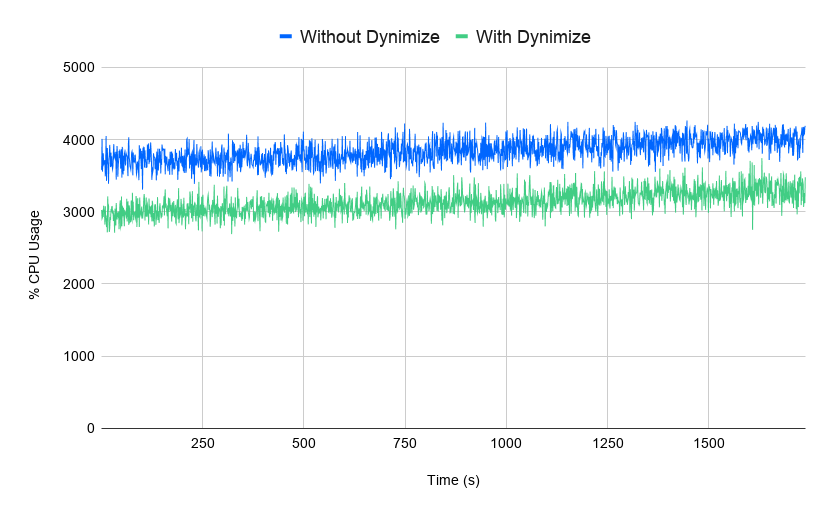
Above you can see the improvement using Dynimize on a very challenging transactional workload, with an overall improvement factor of 1.23, or a CPU usage reduction of 19%.
WordPress
How about something real like WordPress? The next test uses an EC2 server running the exact same VM image used to serve this blog. The loadtest tool was used for benchmarking since it allows for fixed rate workloads.
loadtest command:
loadtest -t 600 --rps 80 -c 8 http://127.0.0.1/blog/
Hardware
| Instance Type | AWS EC2 t3.2xlarge |
|---|---|
| Cores | 8 virtual |
| RAM | 32 GB |
| Storage | 40 GB EBS SSD |
Software
| MySQL | 5.7.28 |
|---|---|
| Distro | Ubuntu 18.04.2 LTS |
| Kernel | 5.0.0-32-generic x86_64 |
| NGINX | 1.14.0 |
| PHP | 7.2.24 |
| WordPress | 5.2.4 |
| Driver | loadtest |
The runs were performed with the WordPress page cache disabled in order to stress MySQL, which is what happens when a logged in user accesses this blog. Below are the results:
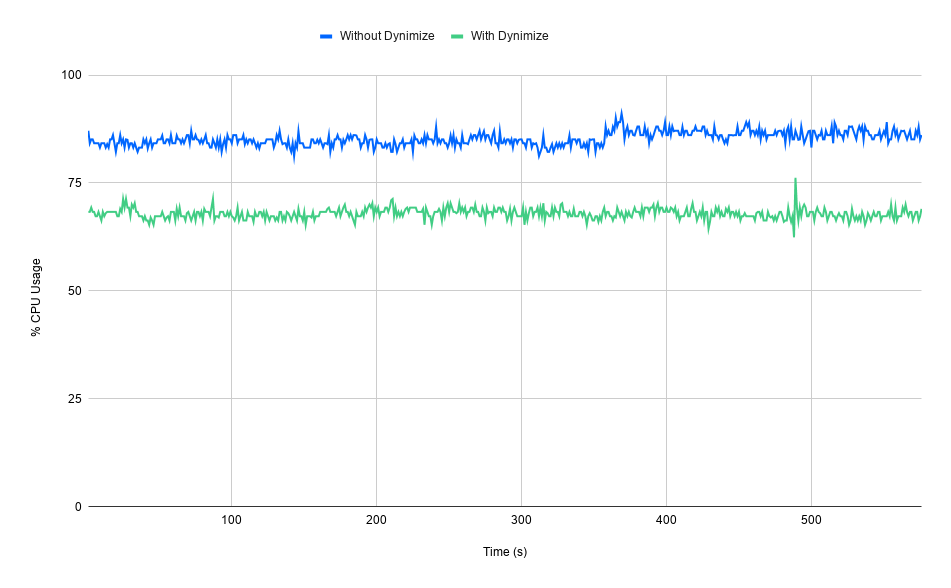
The above graph shows a reduction in MySQL CPU usage with an overall improvement factor of 1.26, or a CPU usage reduction of 21%.
Conclusion
In the end we were able to reduce MySQL and MariaDB CPU usage on three very different workloads by using Dynimize: Point Select by 31% with an improvement factor of 1.44, TPC-C by 19% with an improvement factor of 1.23, and WordPress by 21% with an improvement factor of 1.26. Note that reductions in response time were omitted from these results so that we could focus on CPU usage in this post, and we will save that for another post.
David Yeager
David Yeager is the founder of Dynimize Inc, with over a decade of experience in just-in-time compiler development. He is passionate about computer architectures and software performance, and his mission is to see dynamic compilation and optimization accelerate all workloads (through Dynimize).